As a business owner, are you sure what is driving the costs for your business? Are you looking for a more informed way to allocate your companies resources? If yes, conducting a Cost Driver Analysis can provide you a broad understanding of the drivers of your business costs, which can help you make rational strategy decisions.
What is Cost Driver Analysis?
Cost Driver Analysis means analysing the various possible drivers for a particular type of cost or activity and explaining their cause-and-effect relationship between the activity and cost driver. A Cost Driver is that factor or variable which has a cause-and-effect relationship with the total cost. For example, number of kilometres’ driven, petrol price and fuel efficiency are the cost drivers of monthly fuel cost. The higher the number of kilometres’ driven, the higher the fuel cost per month. The higher the petrol price, the higher the fuel cost per month. While the higher fuel efficiency, the lower the fuel cost per month.
The driver with high positive correlation with the cost suggests that it moves in the same direction. While the driver with high negative correlation with the cost suggests that it moves in the opposite direction. Therefore, cost drivers with high correlation are recommended to be used for making decisions relating to apportionment of cost or reduction of cost.
Why is Cost Driver Analysis important?
For a business, having a clear understanding of cost drivers is vital for effective business costing and forecasting. Suppose a manager knows what is driving its costs with a reasonable accuracy, they can then focus on reducing the quantity of that cost driver. As in the previous example, the monthly fuel cost can be lower by reducing the number of kilometres’ driven, choosing a cheaper petrol, or improving fuel efficiency.
Case Studies
Recently, Forecast conducted a Cost Driver Analysis for a leading University. It identified the major drivers of its operational and capital expenditure items, which helped the University set their operational budget, and make resourcing allocation and strategic decisions.
Approach
To provide analysis and insights into cost drivers, the following activities were conducted:
-
-
Data Preparation and Collection
-
Forecast worked closely with the University’s Finance and Research Departments to agree what drivers should be included and what data should be collected. Here, drivers which are relevant to driving costs were selected as they have cause-and-effect relationships with costs. The University then prepared a list of drivers and collected data on historical values for the financial and non-financial datasets required.
-
-
Analysis on the Drivers & Data
-
Once the financial and drivers’ data have been finalised, Forecast ran a series of analysis:
-
-
- Calculate the correlations between drivers
- Adjust the costs for inflation and identify the trend
- Calculate the correlations between costs and drivers, identify which drivers are most relevant to explaining the variability in costs
- Create charts to show the relationship between costs and drivers
-
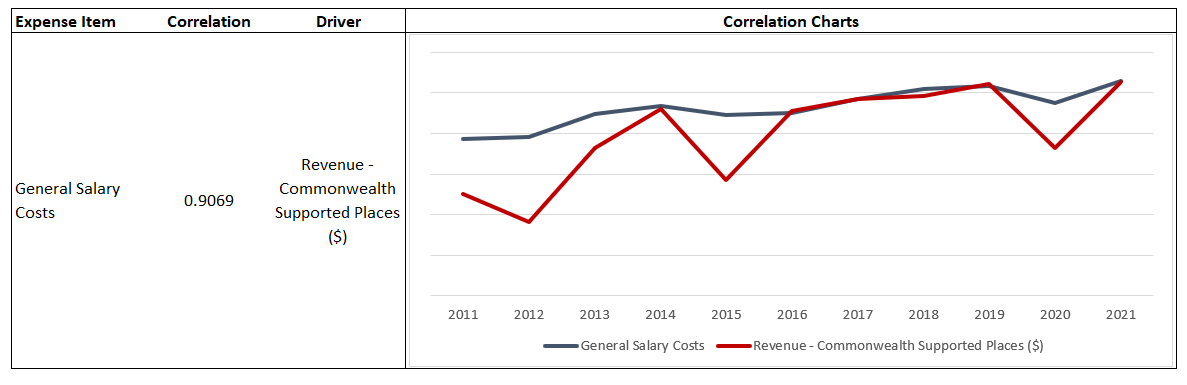
For example, General Salary Costs is 90.69% correlated with Revenue – Commonwealth Supported Places. In the correlation chart, we can see that they moved in the same directions in most of years. This shows a strong and positive association between them, which suggests that increasing in Revenue – Commonwealth Supported Places leads to increasing in General Salary Costs.
Outcome
Forecast prepared and delivered a Cost Driver Analysis model with a series of insightful dashboard outputs for the University. The model allows user to assess the correlations quickly and meaningfully between costs and drivers. It tells the user what drivers are in line with costs, which helps the University Finance Department to allocate and forecast resources accurately.
This form of analysis can be applied across a broad range of industries and situations. Whilst some of the insights gained will reinforce what is already generally known, there will be new insights from the data that often surprise. It also provides comfort to finance and business teams that budgets are based on real data and to executive teams that the drivers of costs are well understood.