Data Science and Financial Modelling
All business managers and owners make decisions that will impact the future performance of their business. Often these decisions are made based on previous experience, but it is also common to develop a model of the business to simulate the impact of those decisions.
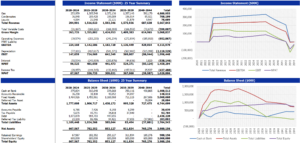
Financial forecasting refers to a process of estimating or predicting the future outcomes of a real-world system such as business. This is commonly developed in Microsoft Excel as a financial model (for example budgeting, forecasting, valuation, investment viability), or an operational model (for example supply chain, demand prediction, network planning). Forecasting models can be very useful to help predict how a business will perform in the future.

Data science methods can play a role in achieving more informed and confident decisions. When data science is integrated into financial modelling this can improve the accuracy and robustness of the model assumptions and outputs.
Data science relates to extracting the required information from large datasets and using this information to provide insights and predictions from this data. Therefore, data science and subsequently the statistical information we gather by applying concepts of data science can be extremely useful for analysing the patterns and trends in historical data and making predictions for the future based on these insights.
All businesses can use financial models to project financial returns, evaluate acquisition targets, or to carry out financial planning and budgeting. Forecasting provides management with valuable insights into the way the business has performed in the past and the way it will perform in the future.
Financial models can be broken into 2 key groups:
- Qualitative Forecasts: based on assumptions, and
- Quantitative Forecasts: based on historical data and trends
Quantitative Predictive Models
There are a few approaches for developing quantitative predictive models:
-
- Regression Analysis: Regression analysis is widely used among financial models. It investigates the relationship between two different variables. One is dependent, and another is independent.
Examples of regression analysis include logistic regression which models the probability of events given a set of inputs, and linear regression which predicts the value of a variable based on the value of other variables. These methods can help businesses identify appropriate values for assumptions that are used in a financial model.
-
- Econometrics Model: This type of quantitative forecasting model involves mathematical equations in the models. These equations explain the relationships among multiple economic variables.
The connections among the variables such as inflation or exchange rates is useful in comprehending their effects on business’s performance. A simple example can be as follows:
Assume that the monthly spending by consumers is linearly dependent on consumer’s income in the previous month. The aim in this model equation is to obtain the estimates of parameters, a and b. The estimates of a and b will in turn will make the predictions for future consumption.
The model could have the equation C(t) = a + bY(t – 1) + e(t), where C(t) is the consumer spending in month t, Y(t-1) is the income of the previous month, and e(t) is an error term.
-
- Index Number Method: This forecasting method is also known as barometric or leading indicator method.
This approach uses historical indices to indicate the expected future direction. As an example we can provide indications for businesses to prepare for declines or increase in demand depending on the health of the local or global economy.
One caveat of using this type of forecasting is that this method is more useful for the short-term goals. For example, you can use this method to help predict where the economy (e.g., CPI/GDP) is headed in the near future and how that is going to affect the business.
-
- Time-series analysis: This type of forecasting model uses extensive historical data and past trends.
This type of modelling examines the trends, cycles, and seasonal changes as well as irregular variations to identify a trend in a data. There are number of methods that are used to conduct time series analysis in financial forecasts:
- ARIMAX models essentially forecast future values by using a function of values in the past along with forecasts of other variables. For example, to predict how much fuel a petrol station will sell in the future you could use past sales to help predict the future combined with an outlook on fuel prices, the weather, the number of public holidays etc. The logic is that fuel sales next week should be close to fuel sales last week, fuel sales should rise as fuel prices fall, more people will drive to work if the weather is poor, and there will be less people in major cities if there is a public holiday.
- Prophet is an open-source tool developed by Facebook that uses seasonal effects in time series to predict future values. It is a fully automatic procedure that enables you to develop forecasts quickly and easily. Prophet also allows users to adjust forecasts and add domain knowledge through interpretable parameters.
- Auto Regressive Neural Networks use prior values and deep learning methods to predict future values. This approach is similar to ARIMAX models, but it loses the interpretability of the model since it uses neural networks to learn the coefficients of the autoregressive terms. Other deep learning techniques such as Recurrent Neural Networks can also be used to forecast future values.
Implementing Quantitative Models
The four steps below are a good guide to follow to implement these quantitative forecasting models.
- Choose a question or problem to ask of your data. For example, a pizza chain store might ask the question “what quantity of each pizza type will we sell each day next month across our 250 stores”.
- Explore historical data. The past teaches us about the present. Exploring the available historical data will give us the tools to analyse and explain the issues and see patterns.
- Select the path that best reflects the business demands. If your company is looking for, short-medium term predictions, we might study your company historical data and using time series techniques, we could provide you with accurate predictions.
- Observe any patterns, trends, and exogenous factors to make a robust forecast. The pattern recognition is important as this determines if the processes followed so far are reliable into the future.

