A valiant Jimmy Butler has led the underdog Miami Heat to score a win over the star-studded Los Angeles Lakers, with the NBA Finals series now at Lakers 3 – Heat 1. Going into Game 5, I question whether the one-two punch of LeBron James and Anthony Davis is simply too much for the Miami Heat to overcome twice.
To get a clearer picture of just how dangerous the LeBron James and Anthony Davis combo can be, we ran some simple analysis on their individual 2017-2018 seasons when they were on separate teams. The 2018-2019 regular season saw both players having a reduced number of games played compared to their two previous seasons with LeBron James facing a groin injury on his first season with the Lakers and Anthony Davis requesting a trade away from New Orleans in his final season there.

In the 2017-2018 season, Anthony Davis was the star player of New Orleans Pelicans, taking them to the Western Conference Semi-Finals and scoring one game win over the stacked super-team of Kevin Durant, Steph Curry, Draymond Green and Klay Thompson on the Golden State Warriors. In this same season LeBron James was on his hometown team of the Cleveland Cavaliers and put up incredible numbers to bring his team to the finals against the Warriors super-team.
In the chart below we analyse the field goals (shots excluding free throws) attempted and made in the 2017-2018 regular season. When we plot the top 20 players by field goals made many familiar names pop up, but two key players stand out visually on the chart. Those two players are none other than LeBron James and Anthony Davis who are now on the same team. (Click to enlarge)
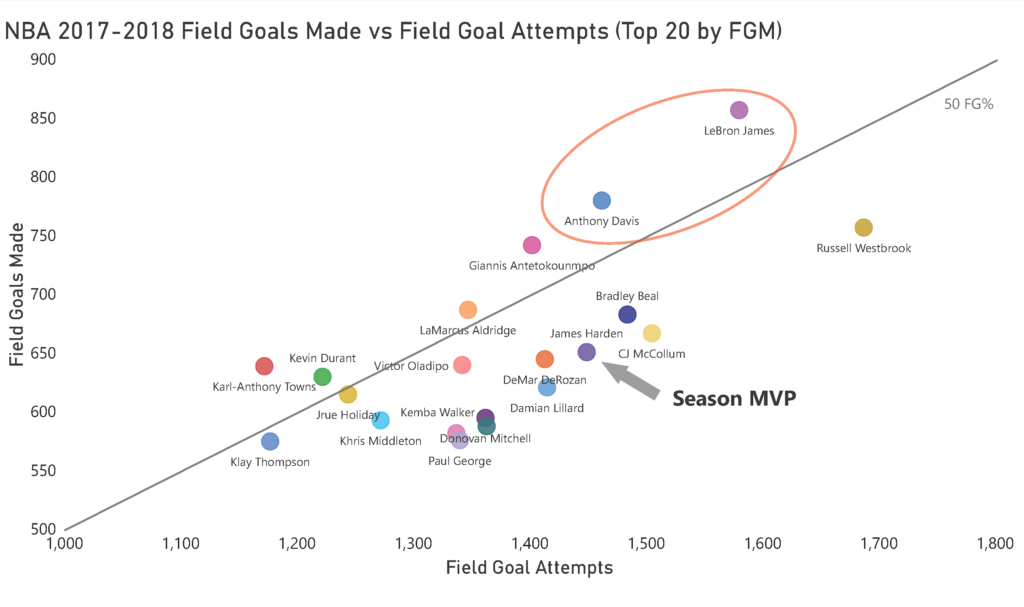
The furthest divergence above the 50 FG% line belongs to the big man Karl-Anthony Towns who had a 54.5 FG%. LeBron James and Anthony Davis came in second and third respectively at 54.2 FG% and 53.4FG%. The damage done by Anthony Davis and LeBron James extending outwards on the chart shows a different sort of impact. To Karl-Anthony Towns’ 639 field goals made, LeBron James had 857 and Anthony Davis had 780.
All of this is compared to the fact that the 2017-2018 season’s MVP of James Harden, gets lost in the crowd in this chart, sitting at 44.9 FG%. Clearly, there are far for more facets to the game of basketball than just field goals attempted and made, but a chart like this provides a new perspective on how valuable players are to a team.

You may be wondering where Jimmy Butler was in this 2017-2018 season? He was 45th by field goals made and had a 47.4 FG% while playing on the Minnesota Timberwolves. He did not make it past the first round of the playoffs despite being paired with the aforementioned FG% leader Karl-Anthony Towns. This, however, was a different time and the impact that Jimmy Butler has had on the Timberwolves, 76ers and Heat in his last 3 seasons has been palpable. The 2019-2020 Finals are a new chapter and this week we will see just how well Jimmy Butler and the Miami Heat can stand up to the powerful Los Angeles Lakers. (Data sourced from nba.com)

