Customer churn is a significant driver of revenue (modelling) and modelling churn behaviour is a question many data scientists will get involved in. In most cases customer churn is a prime example of a predictive problem where Machine Learning methods regularly outperform more traditional approaches such as Logistic Regression. Even in the small customer IBM Telco Churn dataset ML models outperform regression model due to the complex interactions and non-linear pattern present in the data.
Customer churn in a contractual business setting is commonly defined as ‘the probability that a customer will voluntary cancel the existing contract within the next X number of months’, where X is defined according to the type of business and the problem set in particular. From an analytics perspective, this becomes a classic binary classification problem as all customers either churned – or did not churn.
Not always can churn be so explicitly defined. Think of a non-contractual business such as Amazon, where any purchase might be the last interaction with the company, or could be part of ongoing interactions with the company. For these non-contractual businesses, if a user does not complete a critical event on the platform within a window of time, then customer could be considered to have churned from the platform. The critical event is not necessarily a purchase but can be any interaction; listening to a song on Spotify or log into Facebook. The problem definition here is the problem we are trying to address: “What constitutes a default in a non-contractual business?”.
The challenge from an analytics perspective is this ‘fixed’ window in during which an absence of interactions indicates a churn event. This window should not really be fixed, such as absence of interaction for 30 days, and depending on the business case you could go about applying various methods to come up with a suitable window. In this article we build an intuitive anomaly detection ‘model’ to classify customer behaviour as ‘churn-like’.
If you translate the ability to make claims such as “9 times out of 10, Customer A will make his next purchase within X days” into analytics, we are talking about threshold modelling. If the customer then exceeds their individual threshold, this behaviour is irregular and can be classified as anomalous. To do this, we need the distribution of time between purchase (event) and use levels of. This distribution may be difficult to estimate for each individual customer, especially if the distribution is multimodal, irregular, or when there are simply not events for each customer; let’s come back to the last issue later. We will use the Empirical Cumulative Distribution Function (ECDF) to approximate the quantiles of each customer’s between purchase time distribution, thereby using a non-parametric approach to modelling the distribution. Once we have the ECDF, we can approximate the 90th percentile (or any other percentile) and obtain the relevant estimates.
This is completely ‘model-free’ and requires nothing more than some data wrangling to achieve. First we read in the data, and compute the number of days between consecutive purchases for each customer that has had more than 10 purchases.
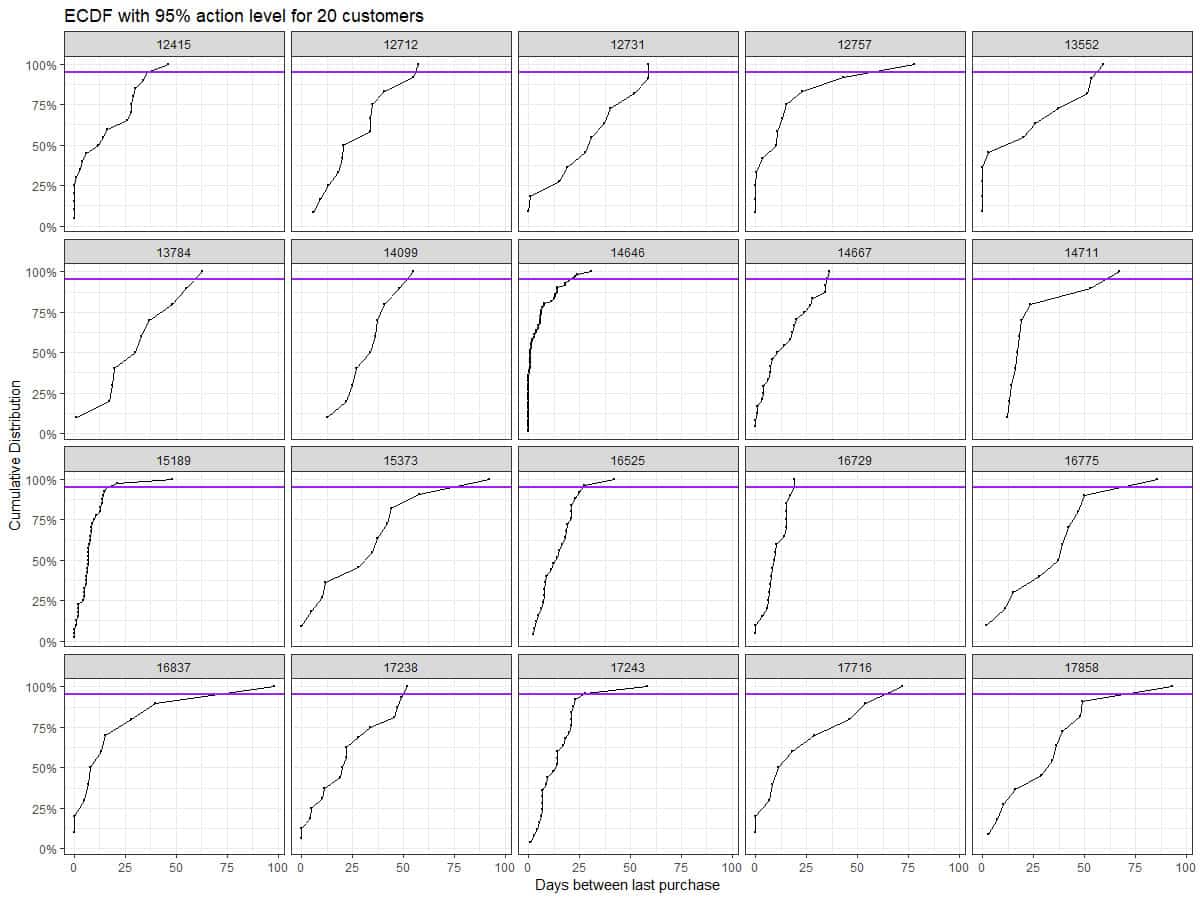
Next plot the time between purchase ECDF and mark the action level for a sample of 20 customers.

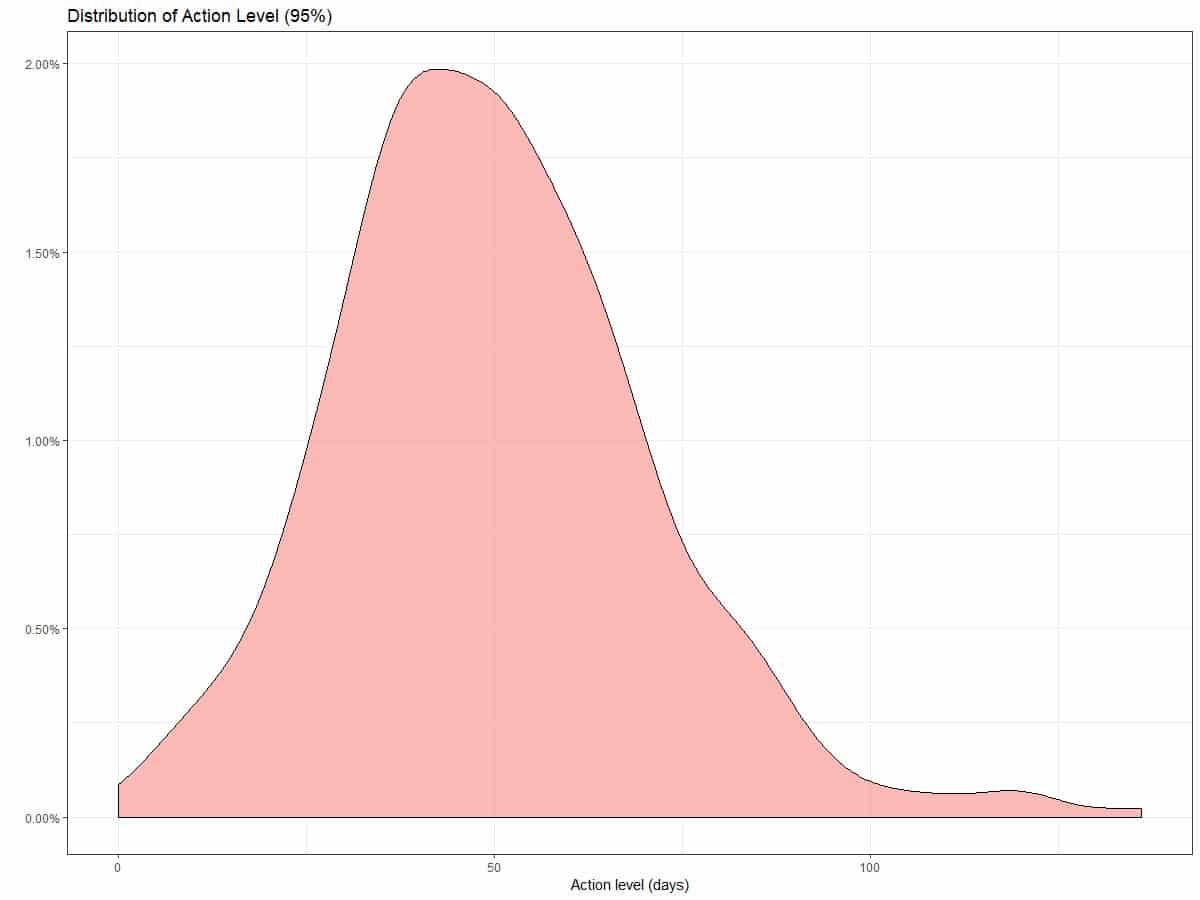
Using the ECDF we can approximate any action level. The plots below show the distribution of action levels in our dataset.

The simple system we built using ECDF percentiles is intuitive and from a business perspective allows the straightforward labelling of behaviour of at various levels of interest. You could think of a system where at various levels of ‘anomaly’, the user is approached and encouraged to interact, through simple reminders or offers.
To by-pass the classic ‘cold-start’ problem here you could use a hybrid approach to establishing the dynamic window of interaction for customers; many customers will have insufficient data to build an ECDF. For those customers that you feel have sufficient interactions (depending on the business and metric) you can build individualised anomaly triggers and for those that do not, you can apply some clustering analysis based on, for instance, static characteristics known at the time of joining, to assign them an informative ECDF.
Depending on the nature of the business or event that you are tracking, it may be desired not to work on the customer level anyway, and use cluster analysis to aggregate customers into meaningful clusters, according to their static characteristic and behaviour, and inform the ECDF using more data points.

