How do you efficiently reach your customers?
How do you optimise your supply chain?
How do you understand the dynamics of geographical areas?
The answers to these questions can redefine the performance of your business.
In a world that is increasingly driven by data, the ability to harness the potential of location-based information has become paramount. For organisations seeking to gain a competitive edge, answers to these critical questions often lie hidden within the sparse landscape of geospatial data.
In this digital age, where every decision counts and every resource must be optimised, we stand at the crossroads of a data revolution. One of the keys to unlocking this revolution is Geospatial Analysis – a cutting-edge field that employs advanced techniques such as DBSCAN clustering and mixed integer linear programming.
What is Geospatial Analysis?
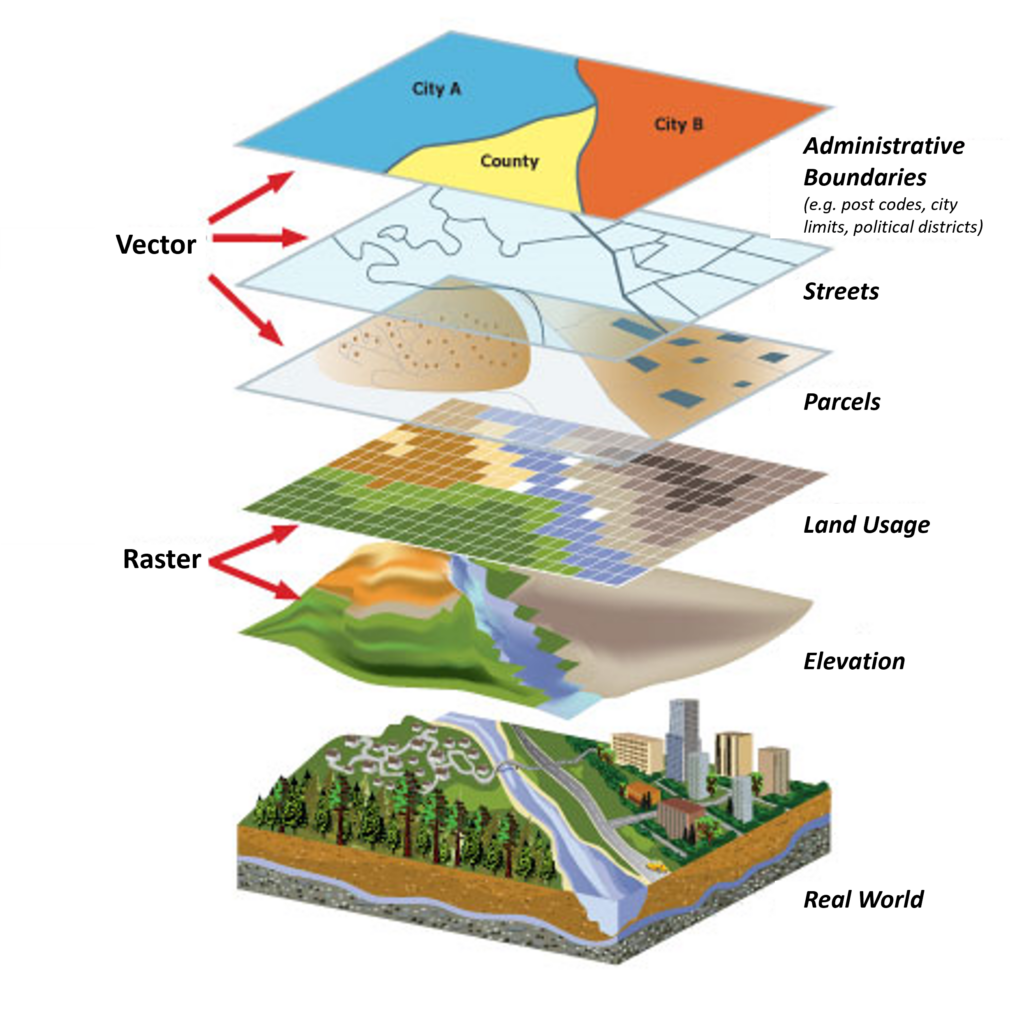
Geospatial analysis is the science (and art) of extracting meaningful information from location-based data. It is the process of turning raw geographical coordinates into actionable insights that drive business growth and efficiency.
At its core, it seeks to answer questions like:
- Where Are Your Customers? Understanding the geographic distribution of your customer base is crucial for most businesses. Geospatial analysis can help identify where your existing and future customers are located, enabling you to target your marketing efforts more effectively.
- How Can You Optimise Your Supply Chain? Efficiency in logistics is vital for reducing costs and improving customer satisfaction. Geospatial tools can optimise delivery routes, manage inventories, and ensure timely deliveries.
- What Lies Beyond the Data? Statistics alone don’t tell the full story. Geospatial analysis goes beyond numbers, offering visualisations that help you comprehend the interplay of features in specific geographical areas.
Case Study: Biofuel Supply Chain
Forecast recently ran an optimisation for a bioenergy company engaged in establishing a biorefinery in rural Australia. The business takes offcuts from crops grown in the surrounding area and to recycle into useful materials – primarily natural gas.
The supply chain optimisation focused on the acquisition and logistics for the delivery of offcuts to the biorefinery. Every year, over 300,000 tonnes of raw material need to be collected from hundreds of farms then stored, transported, and pre-processed before being converted into biofuel. The company required timely information about the most cost-effective way to organise this process, while as the same time having the flexibility to run various scenarios based on weather conditions and crop yields.
Successful models rely on stakeholder engagement as they hold domain expertise including cost insights and knowledge of time constraints. Models should allow parameter adjustments to adapt to changing business needs, incorporate new information, and evaluate the impact of future scenarios or shocks.
This exercise involved:
-
Creating the geospatial optimisation model involved collaboration between Forecast’s data scientists and the business stakeholders. Together, they defined the problem and understood its real-world dynamics.
-
Translating these dynamics into mathematical terms, involving linear equations such as MILP, with a focus on minimising costs or maximising profitability as the objective function.
-
Defining the constraints from the physical, regulatory, and commercial limitations. For instance, transportation constraints relate to truck capacity and legal weight limits.
-
Once the mathematical framework was established, it was converted into software code for optimisation computations.

Area Insights: Unveiling Key Trends
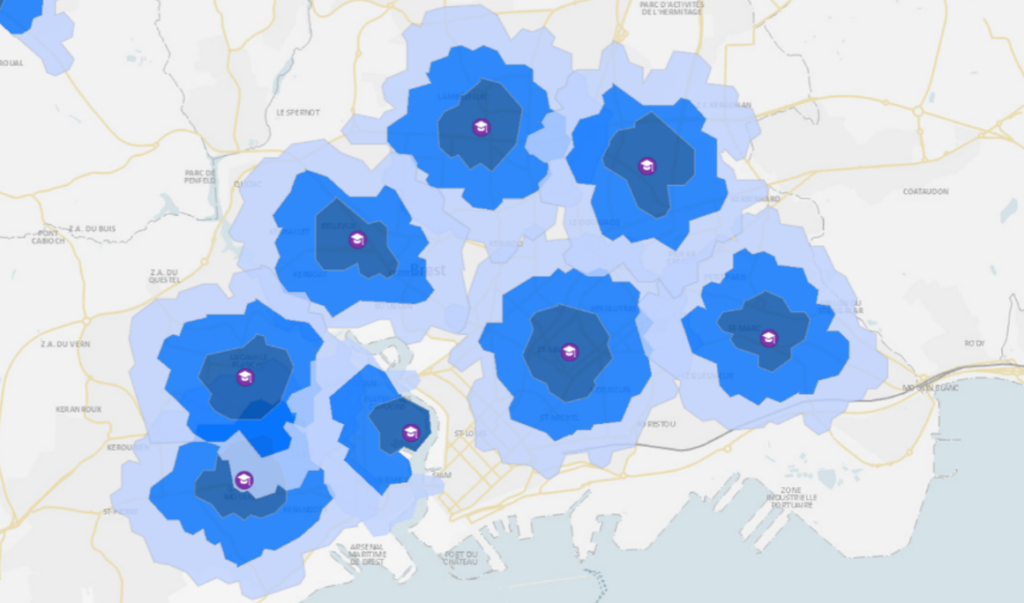
Geospatial analysis can be used to understand and visualise insights within a geospatial region. Before diving into this analysis, it is useful to understand the fundamental concepts in urban planning and catchment analysis. As an example, to analyse daily lives effectively we can adopt the 15-Minute City methodology (FMC or 15mC). This aims to provide residents with essential amenities within a 15-minute isochrone by foot or bike. This controversial concept enables catchment analysis for better understanding target groups.
- What is an Isochrone? An isochrone is a radius-like map connecting points relating to the same travel time. Isochrones allow us to visualise and comprehend precisely what areas fall within this a catchment. By drawing isochrones, we gain a spatial understanding of accessible zones and people reached, which is pivotal for crafting urban layouts.
- Using Catchment Areas Understanding catchment areas is fundamental, whether it’s defining the reach of a local healthcare facility or identifying the market for a retail business. Through the delineation of catchment areas or exclusive marketing zones, resources can be optimally located and services accessible within the desired time frame. The analysis can also reveal which customers fall under the isochrone of a focus point, enabling targeting of potential customers with similar features in comparative catchment areas.
- Data Insights & Visualisations The use of Census data and consumer profiles to gain insights into demographics, lifestyles, and preferences of communities. This foundational data source forms the bedrock of the analysis, providing a comprehensive understanding of the people within a given geographical area. Forecast can unlock the potential of proprietary data sources to work alongside Census data, helping business tailor their services to the unique needs and behaviours of their customer base.
Using data science modules, Census and proprietary data can be transformed into interactive visualisations that showcase actionable insights, aimed to empower decision-makers.
Customer Profiling & Segmentation
In any Customer Segmentation use case, the objective is to comprehend and expand your customer base, whether for new ventures or optimising existing facilities. This process involves visualising your customer data, conducting cluster analysis, and developing interactive dashboards that yield actionable insights.
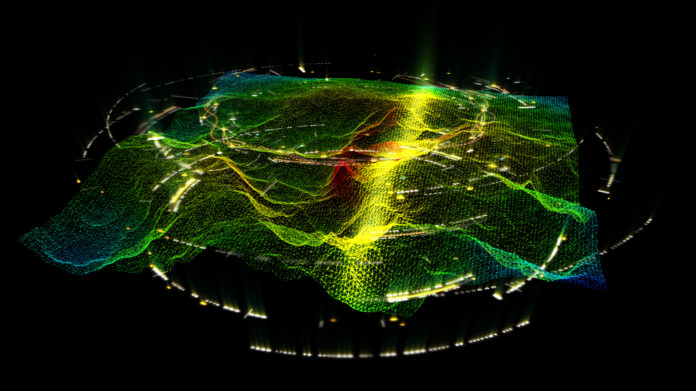
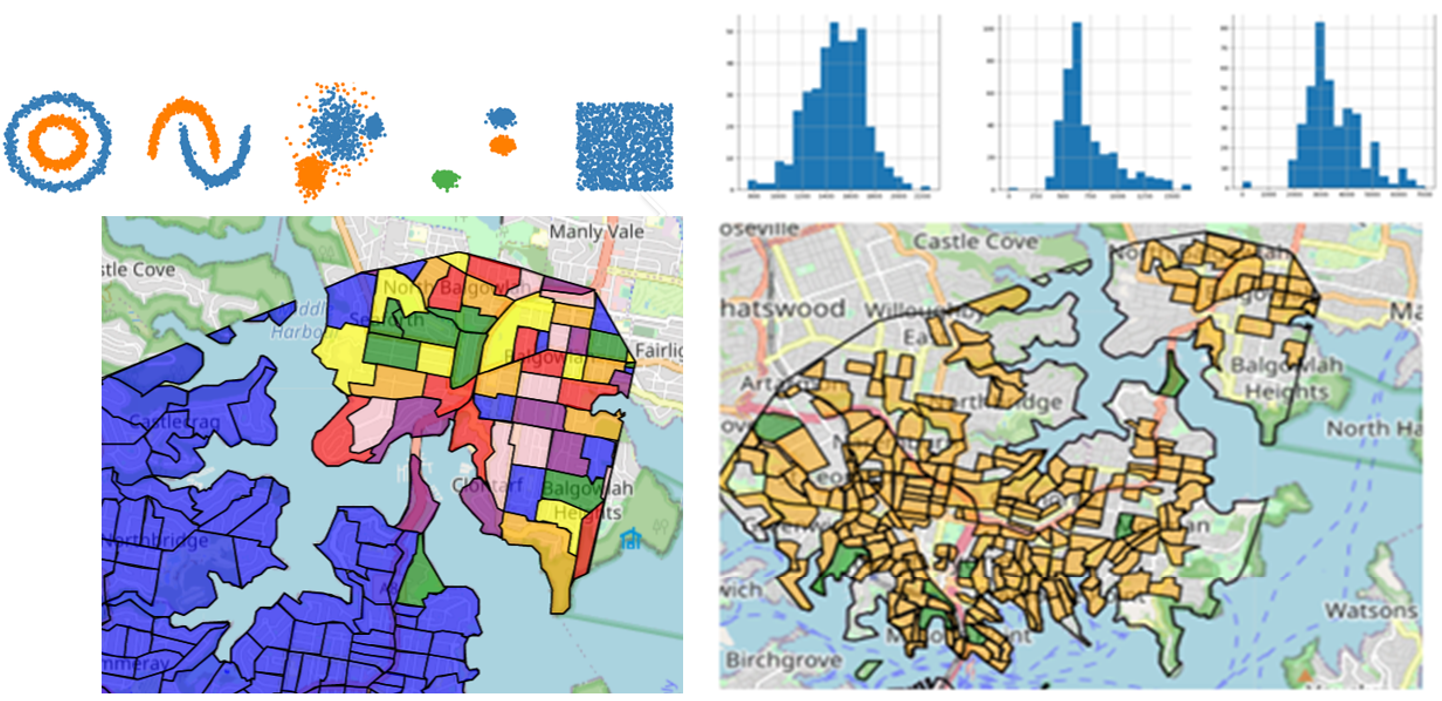
- Initial Data Analysis and Visuals Leveraging exploratory data analysis can reveal trends within catchment areas. The existing Census data supplements your business datasets (for example from your CRM), enriching demographic and geographic insights. Visualisations typically involve geospatial data via histograms, 3-D heatmaps and time-series visualisations.
-
Customer Segmentation Following data preprocessing, density-based algorithms can be deployed to uncover patterns and identify potential customers with shared attributes. These insights are then mapped for visual clarity. To understand local demographics cluster analysis techniques can be used, particularly the density based DBSCAN algorithm.
DBSCAN – Overview
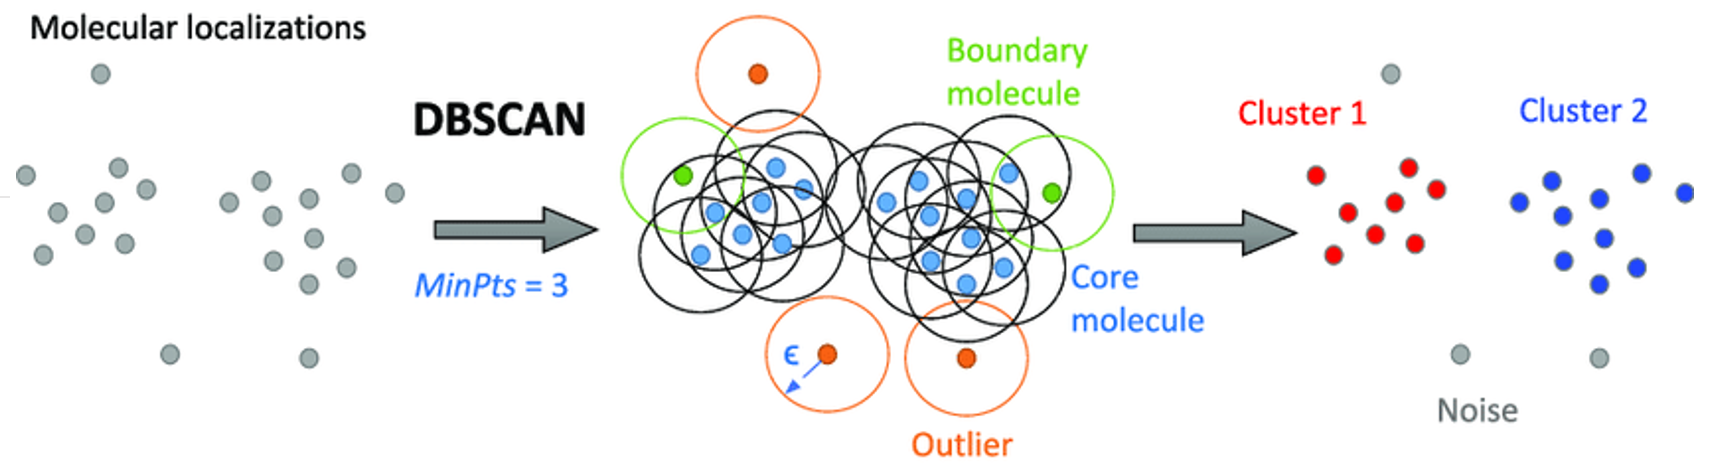
Clustering is a technique that organises a dataset by grouping similar data points together while discerning dissimilarities among them. DBSCAN stands for Density-Based Spatial Clustering of Applications with Noise. It is able to find arbitrary shaped clusters and clusters with noise (e.g. outliers). The main idea behind DBSCAN is that a point belongs to a cluster if it is close to many points from that cluster.
Parameters:
eps: The distance that specifies the neighbourhoods. Two points are considered to be neighbours if the distance between them are less than or equal to eps.
minPts: The minimum number of points to define a cluster.
The benefit of this model is its ability to handle numerous features when drawing similarities. Users do not need to preset the number of clusters (unlike k-means clustering). The density-based algorithm will also find outliers, useful for anomaly detection. This model can be applied to cluster points based on their geographic location and also on their demographic features.
- Visualise the Clusters After finding target or potential customers with shared attributes, we bring these discoveries to life through dynamic visualisation. Leveraging powerful data science modules like Folium and Matplotlib, interactive maps are created that showcase clustered groups with distinct colours, revealing areas where similar individuals congregate. This interactive approach allows businesses to gain immediate contextual understanding. By visualising data in a highly engaging manner, managers can make informed decisions, fine-tuning their strategies to cater to specific customer clusters. It’s the fusion of geospatial analysis, data visualisation, and domain expertise, all within an interactive framework, that propels organisations toward successful outcomes.
Logistics & Supply Chain Optimisation
Routing has long been a formidable challenge for businesses of all sizes. The Forecast Geospatial Tool, armed with powerful modules like OpenStreetMaps and mathematical applications such as Mixed Integer Linear Programming (MILP), can integrate user-provided data seamlessly.
Mixed Integer Linear Programming (MILP)
Mixed Integer Linear Programming (MILP) is a mathematical optimisation method used in logistics. It is ideal for solving complex decision problems involving both discrete (integer) and continuous variables while adhering to linear constraints. MILP aids in making efficient decisions, such as resource allocation in inventory management and route optimisation in logistics, by minimising costs and meeting operational requirements.
Optimised Routes
A Vehicle Routing Problem (VRP) is a logistical challenge that aims to find the most efficient routes for a fleet of vehicles to service a set of customers while minimising costs and adhering to capacity and time constraints.
MILP allows businesses to make binary decisions, such as whether a vehicle should be assigned to a particular customer or not. It optimises the routing of vehicles, considering factors like distance, time, capacity constraints, and vehicle availability. By modelling the VRP as a MILP, you can minimise transportation costs, reduce fuel consumption, and enhance delivery efficiency.
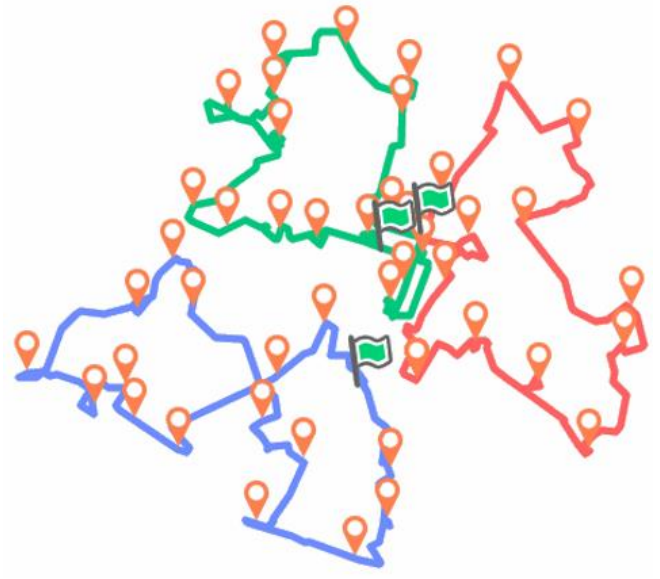
Through the application of Isochrones and the NetworkX interface, companies can go beyond conventional supply chain planning approaches. This route optimisation doesn’t merely get your vehicles from point A to B; it does so in the most time-efficient and cost-effective manner possible.
Strategic Warehouse Location: Finding the perfect spot for your warehouses can be a logistical headache. With Geospatial insights, businesses can identify optimal warehouse locations, minimising transportation and storage costs, and slashing vehicle travel time. It’s about placing your resources where they matter most in inventory management.
Supply Chain Automation: Geospatial Analysis isn’t just an operational tool; it is a strategic partner. MILP allows you to make decisions about when and how much to order or produce, considering factors like storage capacity, demand patterns, and cost constraints. What sets MILP apart is its ability to handle discrete decisions, such as whether to reorder a specific quantity of items or not. It can optimise the allocation of resources, ensuring that you maintain just the right level of stock, minimising storage costs, and maximising customer satisfaction.